Core/Dash MCP Server
Connect your AI agent to real Core Web Vitals data. Debug in chat. Validate in code. No dashboards required.
Trusted by market leaders · Client results
Feed Real Time Data to you AI agent
This is the problem: developers open Claude or Cursor, describe a Core Web Vitals problem and ask for help. The AI gives a perfectly reasonable answer based on generalisations. It speculates. It offers generic advice. It suggests you "check your LCP element" without knowing what your LCP element actually is.
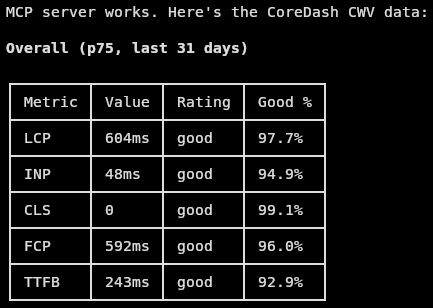
The CoreDash MCP server gives any MCP-compatible AI agent direct access to your Real Time, Real User Monitoring data. All 5 Core Web Vitals with complete brakdown phases + 25 filter dimensions (the same data that powers the dashboard).
Instead of guessing, the AI can tell you that your LCP is 3,102ms on mobile because div.hero-image > img is a 2.4MB unoptimized JPEG without fetchpriority="high". It can tell you that last Thursday's deploy caused an 18% INP regression isolated to button.add-to-cart. It can show you that your TTFB in Germany is 1,400ms because you are not hitting the CDN edge in Frankfurt.
How it works
MCP (the Model Context Protocol) is self-describing. When your AI connects, the server tells it what metrics exist, how to filter, and what each parameter does. You connect and the agent figures out the rest.
Under the hood: stateless HTTPS POST, JSON-RPC 2.0, Bearer token auth. Each request is independent. No sessions, no WebSockets. For the full API reference with request/response examples, see the CoreDash API documentation.
Getting started
Included in your plan. MCP access ships with every CoreDash account. No add-on, no upsell. If you have a project, you can generate an API key right now.
Step 1: Generate an API key
Log in to CoreDash, open your project, go to AI Insights, then Connect Your AI. Give the key a name ("Claude Desktop", "Cursor", "CI Pipeline") and click Generate. Copy it now. It is shown exactly once. We hash it with SHA-256 and only store the hash.
Each key is scoped to a single project. You can create as many as you need and revoke any key instantly. Only project owners can manage keys.
Step 2: Configure your MCP client
Click + in the chat bar, then Connectors → Manage Connectors → Add custom connector. Paste the URL. Claude handles auth via OAuth: you will be redirected to CoreDash to pick a project and accept. No API key needed.
See the full Claude connector guide for step-by-step screenshots.
Browser login (recommended for interactive use). Add the server with no header and no key:
claude mcp add --transport http coredash https://app.coredash.app/api/mcp
The first time you connect, run /mcp inside an interactive session, select coredash, and choose Authenticate. Your browser opens the CoreDash login and consent page. Log in, pick a project, accept. Claude Code stores a short-lived OAuth token that refreshes itself (1-hour access, 30-day refresh) and you can revoke any time. No key to paste. (claude mcp list only health-checks the server and will report a failed tools fetch until you have authenticated, so authenticate from a real session first.)
API key. For headless, automated, or CI runs with no browser, pass a key instead:
claude mcp add --transport http coredash https://app.coredash.app/api/mcp --header "Authorization: Bearer cdk_YOUR_API_KEY"
Go to Settings → Tools & MCP → New MCP Server. Set the URL to https://app.coredash.app/api/mcp and add a header: Authorization: Bearer cdk_YOUR_API_KEY.
Works for any MCP client that reads a JSON config file (Claude Desktop, Cursor, Windsurf, VS Code):
{
  "mcpServers": {
    "coredash": {
      "url": "https://app.coredash.app/api/mcp",
      "headers": {
        "Authorization": "Bearer cdk_YOUR_API_KEY"
      }
    }
  }
}
Step 3: Verify
Ask your AI something simple to confirm the connection works:
"What are the current Core Web Vitals for /product on mobile?"
If it calls get_metrics and returns real numbers, you are live.
Three tools
The MCP server has three tools.
get_metrics is the snapshot tool. "What is the current LCP on mobile?" Use it for any question about the current state. Filter by device, country, page, browser. Group by any dimension to compare segments.
get_timeseries is the trend tool. "Has INP gotten worse since Thursday?" It returns data points over time and automatically classifies the trend as improving, stable, or regressing. The AI interprets the trend for you instead of leaving you to eyeball a chart.
get_histogram is the distribution tool. "What does the LCP distribution look like on mobile?" It returns ~40 buckets showing the full shape of your data. A p75 of 2400ms could mean most users are around 2400ms, or it could mean 60% are fast and a chunk of slow mobile traffic is pulling the tail. The histogram tells you which.
For the full parameter reference, example requests, and response formats, see the API documentation.
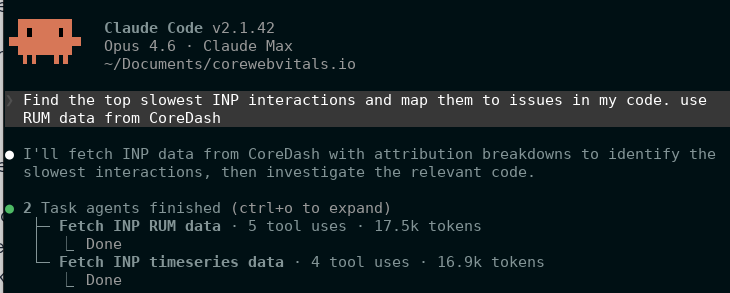
Real example: performance-aware refactoring
Here is what happens when Cursor has the MCP connected and you ask it to find slow INP interactions and match them to real code issues:
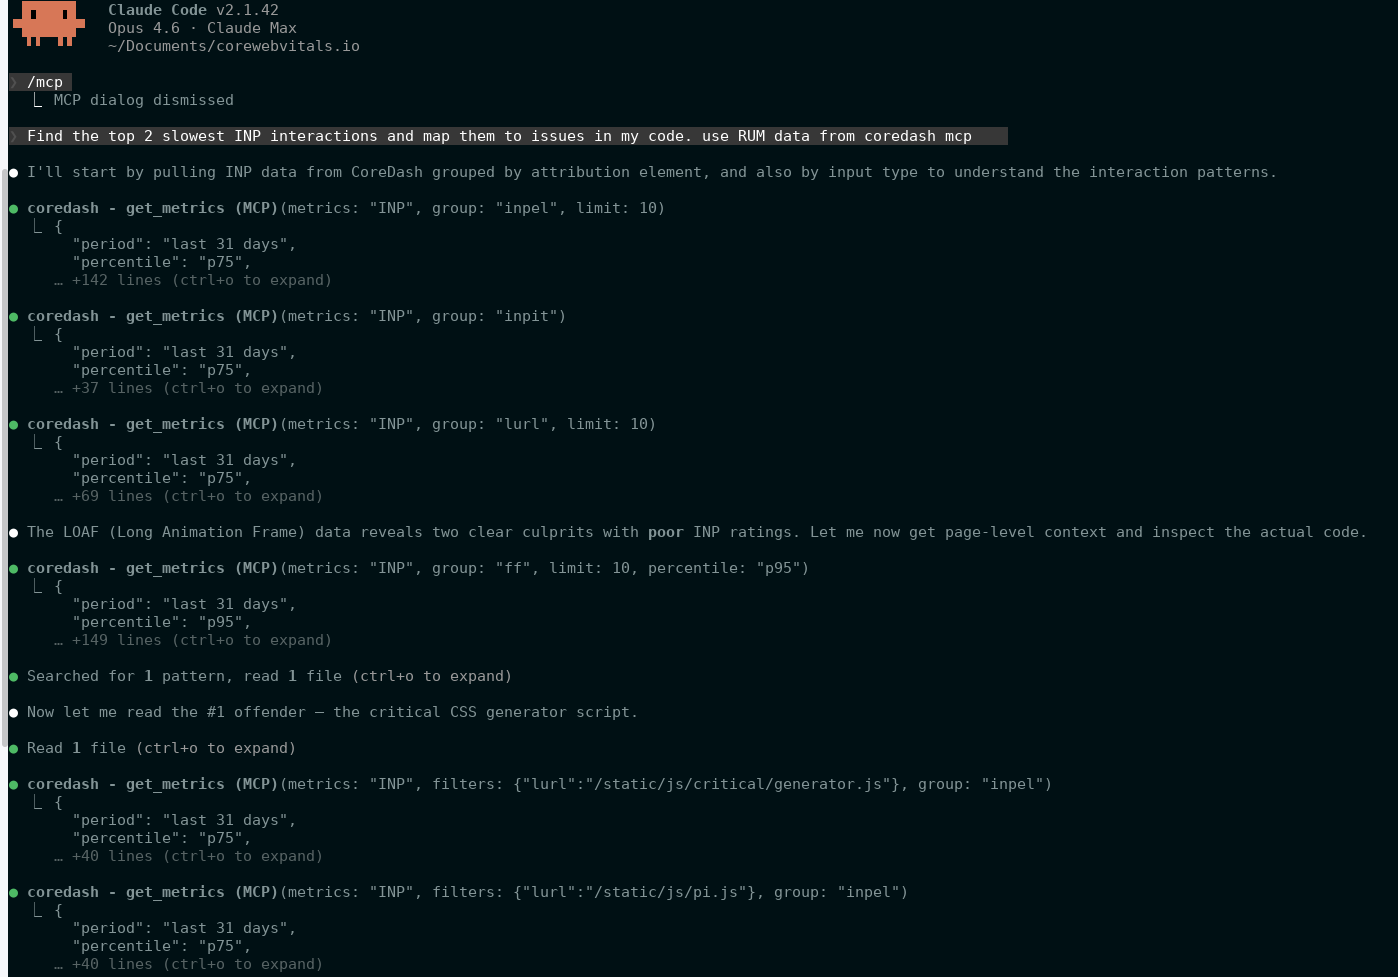
The agent checked the actual INP attribution data, found which interactions were poor, looked up LOAF data to find the scripts responsible, and correctly identified the issues before fixing them. That is the difference between generic best-practice advice and a fix based on what is actually slow.
Rate limits
MCP requests share daily limits with CoreDash AI features. Limits reset at midnight UTC.
| Plan | Daily requests |
|---|---|
| Trial | 30 |
| Starter | 100 |
| Standard | 500 |
| Pro | 1.000 |
| Enterprise | 50.000 |
Security
- Raw keys are shown once. We store only the SHA-256 hash.
- Each key is scoped to one project. No lateral movement.
- Keys are revocable instantly from the dashboard.
- Every key tracks
last_used. Stale keys are easy to spot. - The MCP server is read-only. There is no write path through the API.
- Expired projects automatically reject all API keys.

